S&P500 Daily Action Areas & Price Targets 6/7/26

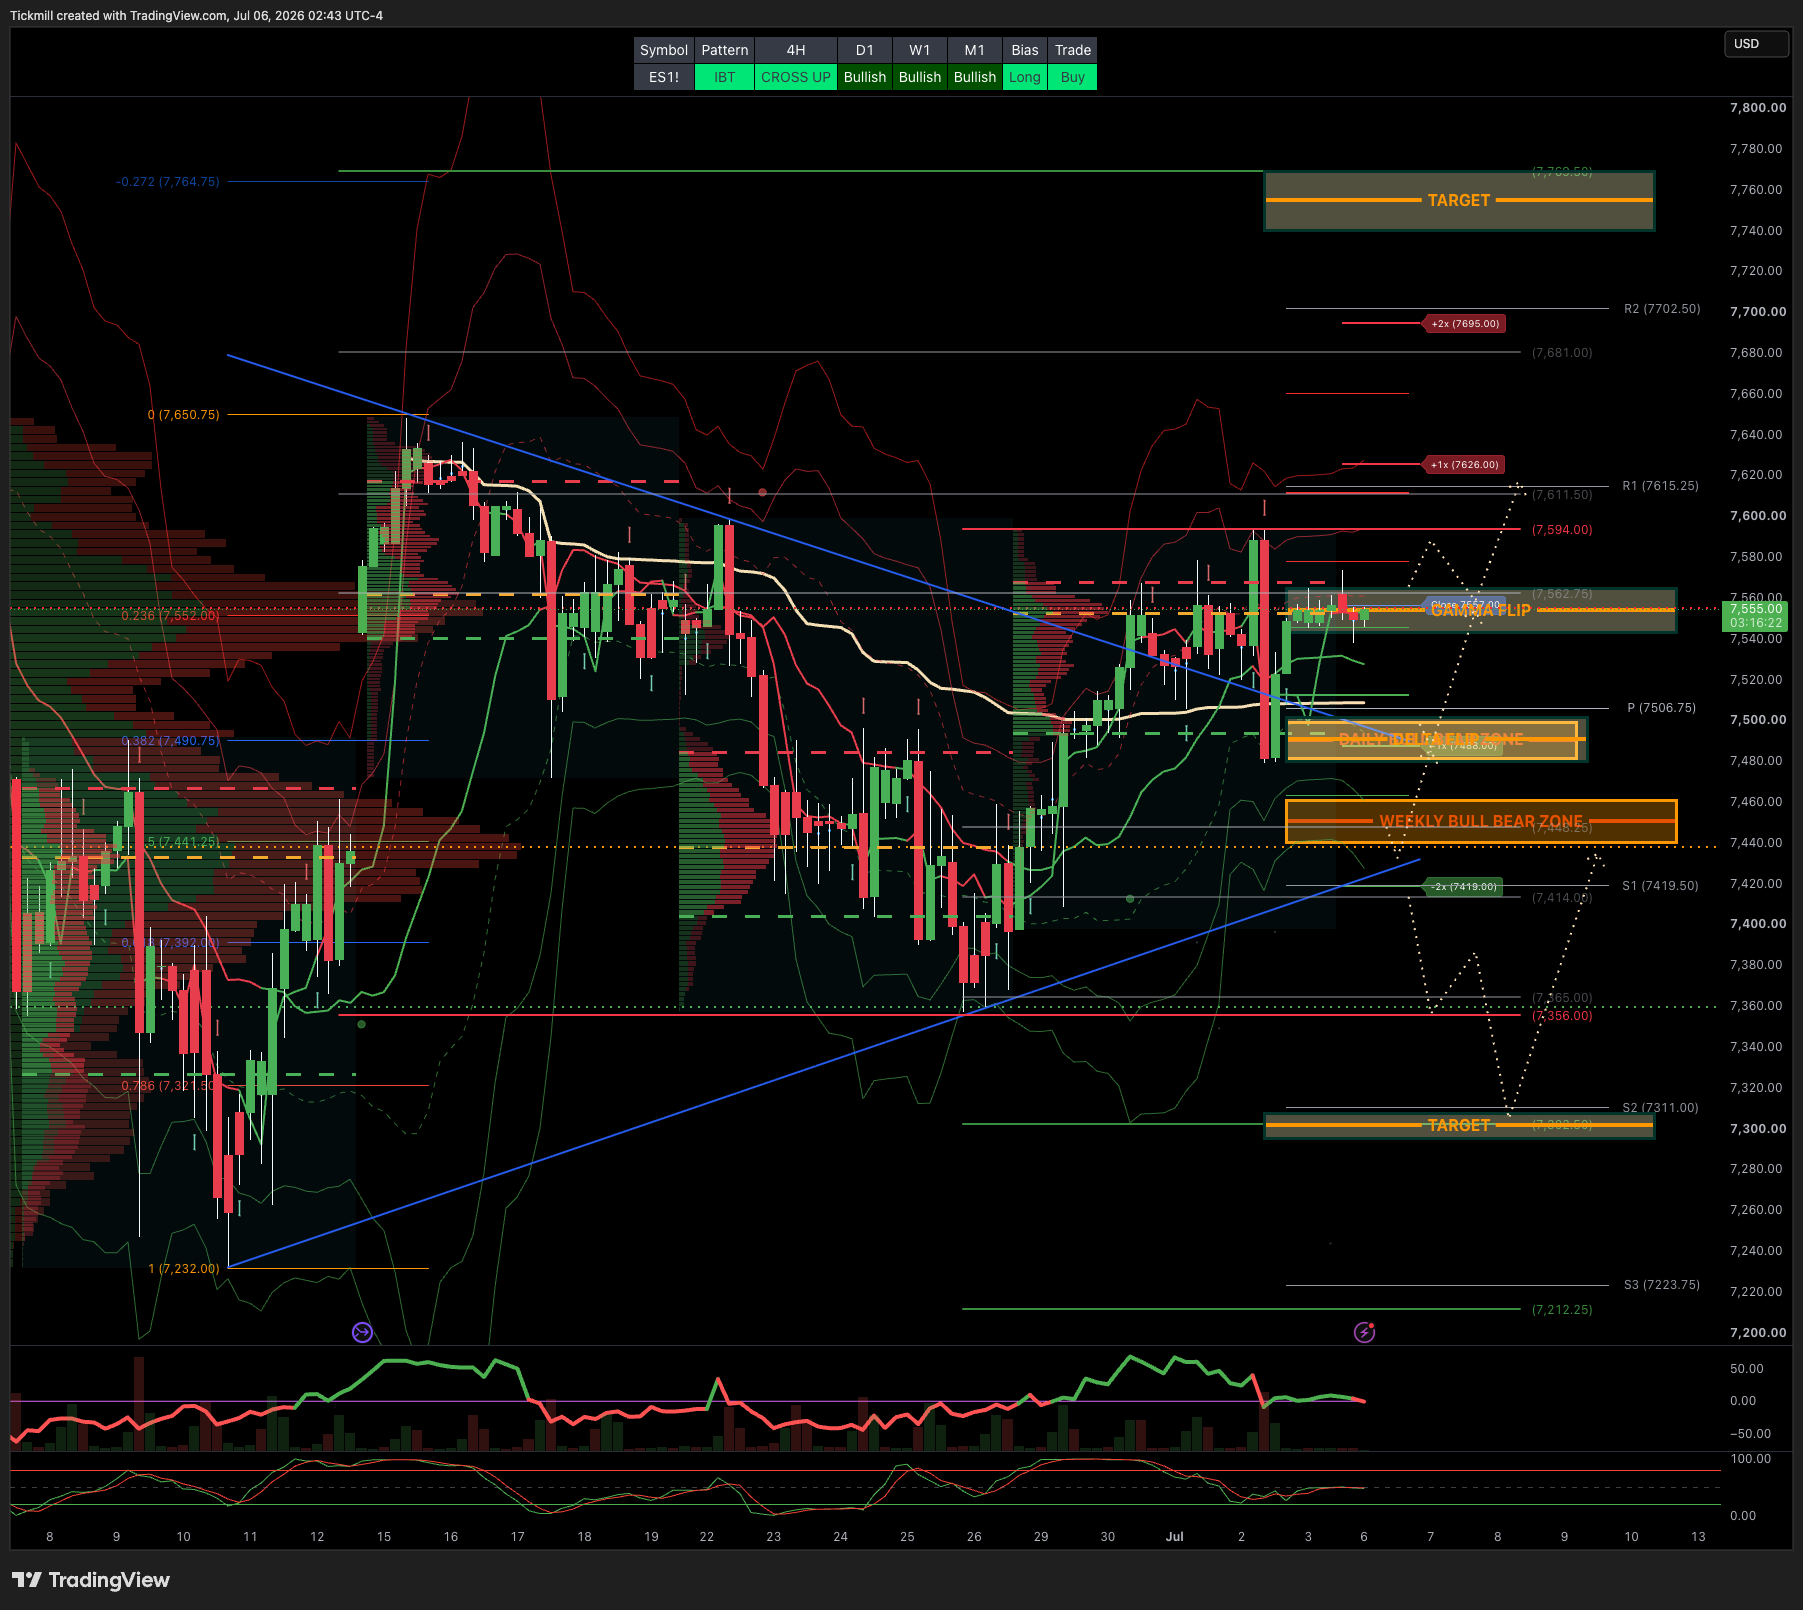
S&P500 Daily Action Areas & Price Targets 6/7/26
***QUOTING ES1! FOR CASH US500 EQUIVALENT LEVELS, SUBTRACT POINT DIFFERENCE***
WEEKLY BULL BEAR ZONE 7460/40
WEEKLY RANGE RES 7628 SUP 7428
MONTHLY RANGE RES 7932 SUP 7384
JHEQX Q3 Collar Short Call Cap: ~7,750 – 7,900 - Long Put Strike: ~7,050 – 7,100 (approx. 5% downside protection) Short Put Strike: ~5,950
DEC2025 OPEX to DEC2026 OPEX is 945 points giving us a range of [5889,7779]
SPX PUT/CALL RATIO 0.79 (The numbers reflect options traded during the current session.) A put-call ratio below 0.7 is generally considered bullish, and a put-call ratio above 1.0 is generally considered bearish.
GS Flow Desk: large S&P 31Aug 7000/7950 strangle in roughly $20mm vega / $115mm premium …My Read – classic “big convexity versus carry” trade: either someone paid a lot to own a wide August move, or someone got paid a lot to bet that the S&P stays comfortably inside the 7000–7950 corridor
DAILY VWAP BULLISH 7530
WEEKLY VWAP BULLISH 7476
MONTHLY VWAP BULLISH 7036
DAILY STRUCTURE - BALANCE 7593/7479
WEEKLY STRUCTURE - BALANCE 7648/7247
MONTHLY STRUCTURE - OTFH - 7199
Balance: This refers to a market condition where prices move within a defined range, reflecting uncertainty as participants await further market-generated information. Our approach to balance includes favouring fade trades at the range extremes (highs/lows) while preparing for potential breakout scenarios if the balance shifts.
One-Time Framing Higher (OTFH): This represents a market trend where each successive bar forms a higher low, signalling a strong and consistent upward movement.
One-Time Framing Lower (OTFL): This describes a market trend where each successive bar forms a lower high, indicating a pronounced and steady downward movement.
DAILY BULL BEAR ZONE 7490/7500
GAMMA FLIP 7555
DELTA FLIP 7491
DAILY RANGE RES 7626 SUP 7488
2 SIGMA RES 7694 SUP 7419
VIX BULL BEAR ZONE 17.4
TRADES & TARGETS
LONG ON ACCEPTANCE ABOVE GAMMA FLIP TARGET DAILY RANGE RES
***ADDITIONAL SETUPS & TARGETS HIGHLIGHTED ON THE CHARTS***
(I FADE TESTS OF 2 SIGMA LEVELS ESPECIALLY INTO THE FINAL HOUR OF THE NY CASH SESSION AS 90% OF THE TIME WHEN TESTED THE MARKET WILL CLOSE ABOVE OR BELOW THESE LEVELS)
GOLDMAN SACHS FICC & EQUITIES TRADING DESK VIEWS
## Cross-Asset / Macro Setup — Energy, JPY, Tariffs, Earnings
The current market setup is increasingly defined by a tension between near-term equity resilience and rising cross-asset fragility. Equities are still supported by earnings growth, AI capex, lower hike pricing after the soft NFP, and broadening beyond first-half winners. But several macro channels are becoming more important for H2: European gas storage risk, JPY intervention risk, tariff uncertainty, and the hyperscaler capex / AI ROI debate.
# 1. European Gas: The Oil Shock Has Faded, But LNG Risk Has Not
The post-US-Iran deal relief has been much more visible in crude than in refined products or European gas. Brent is down sharply since the deal, but gasoline/diesel have fallen far less, and TTF is only down modestly. That dispersion makes sense because the market is no longer pricing the same immediate crude-supply shock, but it is still struggling with product tightness and delayed LNG normalization.
On oil, the crude ramp has been concentrated in crude flows, while demand remains soft. China’s June oil imports falling further from May is the clearest example. But refined product markets remain tight because:
- 1.3mb/d of Middle East refining capacity remains offline
- The US has faced unplanned refinery outages
- The US driving season is in full swing
- Gasoline yields have not fully recovered after refiners previously shifted toward heavier products
- Drone attacks on Russian refineries have intensified, forcing Russia to begin importing gasoline
The result is that refined product inventories may normalize only gradually, potentially not until well into 2027. That means the headline crude price is understating the tightness in the consumer-facing fuel complex.
The more urgent issue is European gas. LNG flows through the Strait of Hormuz have not ramped meaningfully since the deal announcement, and QatarEnergy has extended force majeure on LNG deliveries to Italy into early September. If disruptions are extended to cover October deliveries, market anxiety should rise materially because the injection window is closing.
The key storage math is straightforward:
- If LNG normalization is delayed from the end-July base case to end-August, inventories and prices are likely still manageable.
- If normalization slips into end-September, winter storage risk becomes much more serious.
- In that scenario, 4Q26 TTF would likely trade closer to €50/MWh than the current €40/MWh forecast.
- If flows do not normalize by late August, Northwest Europe may struggle to reach much above 65% storage by November 1.
- Even reaching 80% storage likely requires sustained LNG inflows and potentially above-market prices to attract flexible cargoes away from Asia.
That would create a global LNG price transmission problem. Europe would need to bid cargoes away from Asia, forcing price-sensitive Asian buyers to reduce demand. So the risk is not just European winter tightness; it is a broader LNG reallocation shock.
Market implication:
Energy has moved from a crude-price story to a refined-products and LNG-storage story. Equity investors should not assume lower Brent fully removes the energy tail risk. The most important watchpoint is whether Hormuz LNG flows normalize before end-August and whether Qatar’s force majeure extends into October.
# 2. JPY: Authorities Are Not Tolerant — They Are Tactical
The lack of intervention despite USD/JPY trading through 162.50 should not be interpreted as Japanese authorities becoming comfortable with yen weakness. The better interpretation is that the Ministry of Finance has shifted from predictable “line in the sand” intervention toward a more tactical ambush intervention approach.
Previously, during the April slide, officials issued explicit warnings before intervening. More recently, the rhetoric has been measured despite continued yen weakness. That likely reflects a desire to avoid giving speculators predictable levels. With CFTC data showing JPY shorts still near multi-year highs, surprise intervention is more effective than telegraphed intervention because it maximizes pain for crowded shorts.
But intervention alone is not enough to change the trend. The yen remains under structural pressure from:
- Political pressure on the BoJ
- Expansionary fiscal policy under the Takaichi administration
- Constrained monetary normalization
- FX hedging demand linked to Japanese equities
- Continued outbound direct investment
- Broader Asian FX weakness
- Japan’s digital trade deficit
- Wider front-end rate differentials if the Fed remains hawkish
This is why the latest intervention had less “bang for its buck” than prior episodes. Dips in USD/JPY have not lasted because the broader macro mix still points to yen weakness.
The market has not priced even one full BoJ hike by end-2026, despite the FX move. That reflects a belief that the Takaichi administration will continue prioritizing fiscal expansion and low borrowing costs, while influencing the BoJ’s normalization path. The June economic blueprint urging close coordination with the government, dovish BoJ appointments, and Sato’s statement that Japan has not yet established a firm “inflationary norm” all reinforce that view.
Still, the political pressure point is important. Aso’s unusual public concern about the yen being at a “40-year low” may signal that the LDP old guard is growing uncomfortable with the policy mix. If FX-driven import costs continue passing through into food prices and wage growth fails to keep up, yen weakness could become a domestic political liability. At that point, political survival could force the administration to allow faster BoJ hikes.
Market implication:
JPY remains an attractive carry funder, but intervention risk is elevated and increasingly unpredictable. USD/JPY above 165 and especially toward 170 would likely trigger greater political pressure and increase the odds of actual intervention or a policy shift. Intervention may create sharp dips, but unless the macro mix changes, those dips may still be bought.
# 3. Tariffs: Background Macro Risk, Not Yet the Main Driver
Tariffs remain a live issue, but for now they are likely to stay in the background as a macro driver. The key legal transition is from the current Section 122 tariff regime to a new Section 301 footing.
The current 10% across-the-board tariff under Section 122 expires on July 24 because it can only last five months by law. The administration appears to be using Section 301 to preserve the status quo, with tariffs set around 10% to 12.5% depending on the country. That would be only a slight increase in the effective tariff rate and broadly consistent with the current regime.
The main uncertainty is the second Section 301 case on industrial capacity. The investigation is underway and could be released in the next couple of weeks. The question is whether it:
1. Simply preserves the existing tariff regime,
2. Adds nuance or delayed implementation, or
3. Substantially increases tariffs beyond the current 10%–12.5% range.
The base case is that Section 122 rolls onto Section 301 with roughly the same rate structure. But if the administration announces additional near-term tariffs, the market may need to reprice the macro impact, especially around margins and inflation.
USMCA is another uncertainty, though not an immediate one. July 1 was the review deadline for a ten-year extension, and no agreement occurred. That has no immediate consequence; it just moves the process into annual review, with the next deadline in July 2027. The practical market impact is limited for now because the administration has already imposed tariffs on Canadian and Mexican autos and other products, effectively breaching the spirit of USMCA.
Market implication:
Tariffs are not currently the dominant macro variable, but they remain a risk to margins, pricing power, autos, and supply-chain-sensitive sectors. Avoiding autos due to USMCA risk still makes sense.
# 4. Earnings: The Market’s Real Test Is Margins + AI Capex
Q2 earnings expectations are high. Consensus expects 22% YoY S&P 500 EPS growth, the highest pre-season estimate since 2021. That is slower than last quarter’s realized 27% growth, but still extremely strong. The median S&P 500 company is expected to grow earnings by 9%, which is robust but a deceleration from last quarter’s 13%.
The biggest macro risk to earnings is profit margins. Companies have been talking more about input-cost pressures, especially the challenge of managing rising costs while customer prices rise more slowly. That is negative for margins. However, this may be less dominant this quarter because:
- Energy prices have rolled over,
- Wage pressures remain relatively soft,
- The labor report did not show an acceleration in compensation,
- Revenue expectations may be too conservative.
The upside risk is that the median company beats estimates because analysts are assuming a deceleration in nominal revenue growth that does not appear strongly supported by macro data. If the average stock beats, breadth can continue improving.
But the biggest theme remains AI capex. Last quarter, hyperscalers effectively raised capex guidance by more than $100bn, catalyzing another leg higher in semis, memory, and AI infrastructure. The biggest downside risk would be a signal that hyperscalers plan to cut capex due to slowing demand. That is not the base case. Recent capital raises suggest both the desire and capacity to keep spending.
However, investors should not expect the same wave of positive revisions this quarter. The largest capex guidance revisions usually occur around the turn of the calendar year, not mid-year. The 2026 plans are mostly set, and it is still too early for companies to give full 2027 guidance
That means the market may not get the same upside impulse from capex revisions as it did last quarter. The debate may instead shift toward:
- AI token consumption,
- Where tokens are being spent,
- Frontier models versus open-weight / enterprise use cases,
- Token OpEx, not just token CapEx,
- Returns on AI spending outside hyperscalers.
This is a more mature AI debate. The market is moving from “how much capex?” to “what returns does the capex generate?”
# 5. Hyperscalers: Becoming Attractive Again
The hyperscaler setup is becoming one of the more interesting tactical opportunities. Positioning, valuation, seasonality, and relative performance all point in the same direction.
Key points:
- Hyperscaler stocks have historically averaged +5.45% in July over the last 15 years.
- Mag 7 stocks have been net sold for five straight weeks.
- Gross and net exposures in Mag 7 are near three-year lows, in the 4th and 6th percentiles.
- Hyperscaler NTM P/E has hit a 10-year low.
- Forward revenue estimates have inflected higher.
- The correlation between hyperscalers and memory has broken down.
- Hyperscalers appear to have become a funding leg for the semis/memory trade.
That last point is critical. If investors have funded memory and AI infrastructure longs by selling hyperscalers, then a reversal in the memory trade could produce hyperscaler outperformance. Hyperscalers can therefore serve as both an upside opportunity and a hedge against crowded memory exposure.
The suggested structure — GSXUHYPR 21Aug2026 110% / 117.5% call spread — fits this setup. Indicatively costing 1.5%, with 18% delta and 5x gross payout, it provides upside exposure into a favorable seasonal and earnings window while limiting premium at risk.
Market implication:
Adding upside in hyperscalers looks attractive, especially through call spreads or call-spread collars. This does not require abandoning AI infrastructure; it is a way to rebalance the AI exposure from the most crowded winners toward under-owned platform names.
# 6. The Main Equity Risk: Concentrated Earnings + Stretched Positioning
AI infrastructure stocks are expected to contribute nearly 60% of S&P 500 EPS growth in Q2. The top 10 contributors are expected to account for nearly 75% of aggregate S&P earnings growth, with Micron and Nvidia alone contributing more than 40%.
That concentration is both the bull case and the risk. If AI infrastructure delivers, index earnings look excellent. If capex disappoints or demand slows, the most crowded part of the market could unwind sharply.
Consensus 2027 hyperscaler capex may still be too conservative. Estimates imply capex reaches $920bn in 2027, but growth decelerates sharply from 84% to 22%. Analysts have underestimated realized capex over each of the past three years by an average of 45 percentage points. If that pattern repeats, AI infrastructure estimates could still move higher. But positioning is stretched. Sentiment is at its highest level since December 2024, realized volatility is rising, and memory/semis remain crowded. A wobble during earnings could cause a broader unwind even if the secular capex story remains intact.
Disclaimer: The material provided is for information purposes only and should not be considered as investment advice. The views, information, or opinions expressed in the text belong solely to the author, and not to the author’s employer, organization, committee or other group or individual or company.
Past performance is not indicative of future results.
High Risk Warning: CFDs are complex instruments and come with a high risk of losing money rapidly due to leverage. 69% and 73% of retail investor accounts lose money when trading CFDs with Tickmill UK Ltd and Tickmill Europe Ltd respectively. You should consider whether you understand how CFDs work and whether you can afford to take the high risk of losing your money.
Futures and Options: Trading futures and options on margin carries a high degree of risk and may result in losses exceeding your initial investment. These products are not suitable for all investors. Ensure you fully understand the risks and take appropriate care to manage your risk.
Patrick has been involved in the financial markets for well over a decade as a self-educated professional trader and money manager. Flitting between the roles of market commentator, analyst and mentor, Patrick has improved the technical skills and psychological stance of literally hundreds of traders – coaching them to become savvy market operators!